

How to Evaluate Electrolyzer Flexibility: A 2026 Update on System-Level Performance
November 05th 2026
As more hydrogen projects connect electrolyzers directly to renewable power, developers are asking a sharper version of an old question: what does “flexible” actually mean, and how do you tell a genuinely flexible system from one that just claims to be? John Cockerill Hydrogen’s white paper, Unlocking Electrolyzer Flexibility at Scale, lays out a system-wide framework for answering that. Here’s what to look for, and what the latest industry data adds to the picture.
As more hydrogen projects connect electrolyzers directly to renewable power, developers are asking a sharper version of an old question: what does “flexible” actually mean, and how do you tell a genuinely flexible system from one that just claims to be? John Cockerill Hydrogen’s white paper, Unlocking Electrolyzer Flexibility at Scale, lays out a system-wide framework for answering that. Here’s what to look for, and what the latest industry data adds to the picture.
The Five Factors That Define Flexibility
A single flexibility number on a datasheet doesn’t tell you much on its own. Evaluate any electrolyzer system against five factors together:
- Ramp-up/ramp-down rate: how quickly the system can adjust hydrogen output as available power changes, typically expressed as a percentage of nominal load per second or minute.
- Operating range: the window within which the electrolyzer can run safely. A narrow range can force a shutdown when power dips; a wider one lets the system keep operating through fluctuations.
- Operating modes: how the system behaves across cold start-up, hot start-up, standby, and shutdown. Hot-standby capability means faster resumption and less downtime.
- Degradation rate: not itself a measure of flexibility, but frequent load changes, partial-load operation, and start/stop cycles accelerate wear, so it determines whether that flexibility holds up over the project’s life.
- Tools for planning and monitoring: digital energy management systems that simulate load profiles, forecast renewable supply, and dynamically adjust stack utilization and pricing, determine whether you can actually capture the flexibility your hardware is capable of.
A vendor quoting only one of these is giving you a partial picture.
Plant-Level Minimum Load Defines Your Project’s Flexibility, Not Only the Stack
Minimum load is the lowest share of nominal capacity at which an electrolyzer can keep operating. It is usually specified one stack at a time, and that stack figure doesn’t give you the full picture. What determines your project’s actual performance is the plant-level minimum load, and stack minimum loads rarely translate directly to plant minimum loads, because the bottleneck usually sits in the balance-of-stack (purification, controls, compression, and related auxiliaries), not the stack.
Here’s what that looks like in practice. Say your project needs a 25-MW plant to operate anywhere between 8% and 100% capacity, and the plant is built from five 5-MW electrolyzers, each with an operating range of 40–100%. Looked at one stack at a time, none of them can get anywhere near 8%. Managed at the plant level, you can run one stack at 40% and idle the rest: 2 MW on a 25-MW plant is 8%, and the target is met. The constraint was never the stack; it was how the plant is designed and controlled.
BloombergNEF’s (BNEF) Electrolyzer Price and Performance Survey 2026 shows how some published system figures are derived. Some manufacturers calculate system minimum load by dividing the stack’s minimum load by an integer of up to four, on the assumption that the stacks can be controlled separately (BNEF 2026). Thirty percent of surveyed Chinese alkaline manufacturers use that assumption, and more Western alkaline brands do. Only 17% of proton exchange membrane (PEM) manufacturers apply it (BNEF 2026). PEM stacks and their associated systems tend to have lower minimum loads than alkaline thanks to higher current density.
One PEM supplier reported a 5% system-level minimum in 2021 and revised it to 40% in 2023 after more thorough testing (BNEF 2026). A second practice compounds the first: system minimum load is sometimes defined around the stacks alone, ignoring limits set by other equipment such as the purification unit.
Scale changes the math further. With only one or two stacks, each stack’s individual turndown limit (how far below full capacity it can operate) matters a great deal. Spread across 10 to 20 stacks, that same per-stack limit matters far less. Design your load profile at the plant level, not the stack level, and when you’re comparing vendors, ask for the plant-level minimum load they’ll guarantee, not just the stack spec.
Why Pressurized Alkaline Holds Up Under Variable Power: What the Latest BNEF Data Adds to PEM’s Story
Ramp Rate: Plant-Level Performance Matters More Than Stack-Level Speed
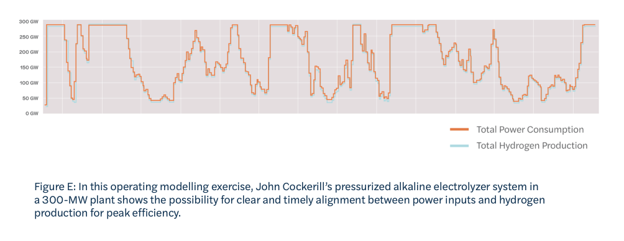
At the stack level, PEM electrolyzers typically post faster ramp rates and wider operating ranges than alkaline, but also higher degradation rates under cycling. Pressurized alkaline’s narrower per-stack operating window matters far less once you’re operating at scale: spread across many stacks, and paired with improved ramp-up/ramp-down capability, lower degradation under start/stop operation, reduced or eliminated need for downstream compression, and real-time control through monitoring systems like John’s Cockpit, pressurized alkaline systems are well matched to variable renewable input at the scale most projects need. A 300-MW operating model shows power consumption and hydrogen production tracking closely across fourteen days of varying load.
BNEF’s newest electrolyzer survey adds a useful caveat to that stack-level ramp-rate comparison. Ramp rate claims are often stack-only. According to BNEF 2026, most original equipment manufacturers (OEMs), especially those claiming very fast ramp speeds of up to 15% of nominal load per second (BNEF 2026), derive that figure by testing stacks alone rather than complete systems, which can overstate real plant-level performance.
Restart Time: Reported PEM Figures Are Moving Toward More Conservative Numbers
Restart-time claims have gotten more realistic. BNEF 2026 also shows the market correcting toward more conservative PEM restart figures. Alkaline systems’ average cold-start time (roughly 1 to 1.5 hours, with warm starts around 10 minutes) is unchanged from BNEF’s 2024 survey. PEM suppliers’ reported numbers moved further: average cold-start time is now about 33 minutes, up from roughly 5 minutes in the 2024 survey, and average warm-start time moved from about 1 minute to about 3 minutes (BNEF 2026).
Conclusion: Know the Scope Behind Every Flexibility Figure
The scope of assessment behind a flexibility figure matters as much as the figure itself. A ramp rate or minimum load measured on a single stack describes something different from one measured across a complete plant, and you need to know which one you’re looking at before you compare suppliers.
The evidence base is also still being consolidated. Both PEM and alkaline technologies still lack sufficient operational experience under intermittent conditions. Because alkaline technology has been on the market longer, though, there is more operational experience with its performance and long-term operation in general. Which technology is right still depends on your project’s specific load profile, hydrogen demand pattern, and cost targets, so ask every supplier to state the scope behind each flexibility figure they quote.
Read the full BNEF Electrolyzer Price and Performance Survey 2026.
(Note: Full report access requires a BloombergNEF subscription.)